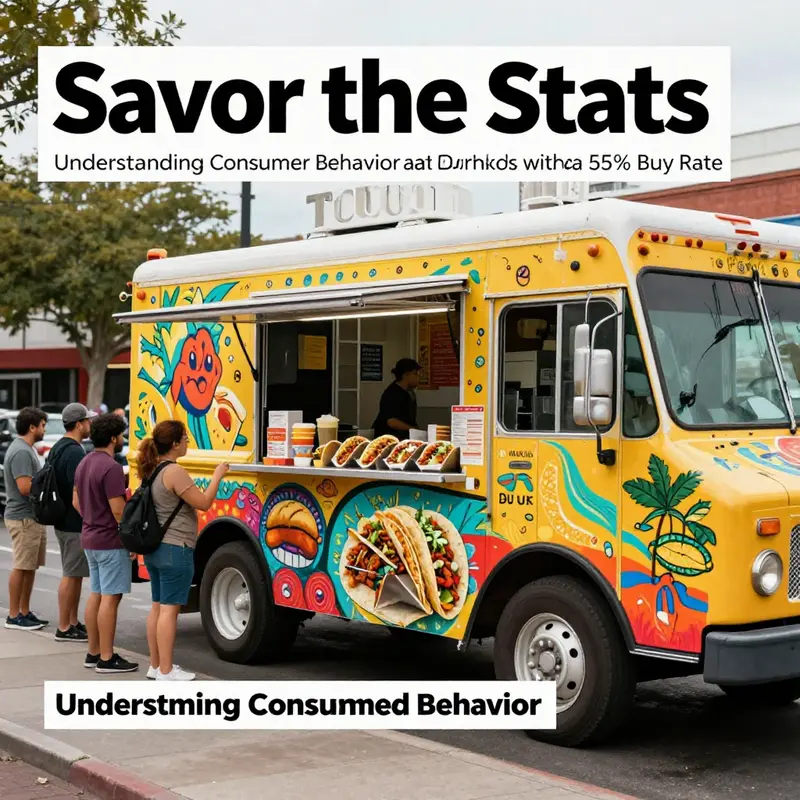
Imagine navigating through the hustle and bustle of urban streets, hungry and seeking a quick bite. Food trucks, particularly those serving up tantalizing tacos and burritos paired with refreshing drinks, play a pivotal role in the lives of urban commuters, outdoor enthusiasts, small business owners, and even first-time pickup buyers. In this exploration, we’ll delve into the fascinating dynamics of customer preferences, the economic influence of these mobile diners on local markets, and the mathematical foundations that guide decision-making. Ultimately, the statistic 0.55—representing the probability that a customer will indulge in either a taco or a drink—serves as our compass through this savory journey.
Reading the 0.55: What a 55% Taco-or-Drink Probability Tells a Food Truck Operator
Interpreting the 0.55: Numbers, Overlap, and Action
A single figure can change how you see a day at your window. The number 0.55 in the food truck scenario does not mean tacos, burritos, and drinks cost fifty-five cents. It instead denotes that, on average, 55% of customers buy a taco, a drink, or both. That distinction matters. One is a price. The other is a behavioral signal about your customers.
When you parse that probability, you uncover practical insights. The probability P(A or B) = 0.55 captures every customer who leaves with at least one of two items: a taco (event A) or a drink (event B). The standard formula clarifies the relationships involved: P(A or B) = P(A) + P(B) – P(A and B). The three parts matter because they separate single-item buyers from those who combine purchases. Knowing only the union leaves ambiguity. You must examine each component to act wisely.
Consider how those components shape decisions. P(A) tells you how many customers choose tacos. P(B) tells you how many choose drinks. P(A and B) reveals cross-purchase behavior. If P(A) = 0.50 and P(B) = 0.20, then P(A and B) must equal 0.15 to produce a union of 0.55. That difference shows overlap: many taco buyers also buy drinks. If P(A) and P(B) differ, the overlap accounts for double counting when you add the two probabilities.
To illustrate, imagine three possible patterns that all yield P(A or B) = 0.55. First, a taco-focused model: P(A) = 0.52, P(B) = 0.10, overlap P(A and B) = 0.07. Most customers buy tacos. Drinks are occasional add-ons. Second, a balanced cross-sell model: P(A) = 0.35, P(B) = 0.45, overlap P(A and B) = 0.25. Here many customers buy both. Third, a drink-centric model: P(A) = 0.20, P(B) = 0.60, overlap P(A and B) = 0.25. Drinks dominate. Each scenario yields the same 0.55 union, yet their operational implications differ sharply.
This is why the union alone cannot drive decisions. A 55% union shows that more than half your customers touch tacos or drinks. But whether to stock more tortillas, buy extra beverages, or staff another line depends on the internal mix. If P(A and B) is high, then combo promotions and bundled pricing will likely perform well. If P(A) is high but P(B) is low, targeted beverage upsells can grow average ticket size. If P(B) is high while P(A) is low, you may experiment with portable snack items to pair with drinks.
Estimating these probabilities requires reliable data. Point-of-sale systems that record each item make the task straightforward. Each transaction maps to counts for tacos, burritos, and drinks. With a good sample, compute relative frequencies: P(A) is the number of transactions including a taco divided by total transactions. P(B) is the same for drinks. P(A and B) counts transactions containing both. For trucks without advanced POS systems, manual tallies at intervals work. A staff member can track a random sample of hours, noting combos and single-item buys. Keep samples representative across weekdays, weekends, and special events to avoid bias.
There are practical caveats. Sample size affects accuracy. A few hours of observation in a single weekend can mislead. Time of day skews results: lunch crowds behave differently than evening customers. Special events drive atypical demand. Menu changes alter behavior. Promotions shift probabilities temporarily. That is why probability estimates should be updated regularly and segmented by context. Track separate P(A), P(B), and P(A and B) for breakfast shifts, peak lunch windows, and late-night service if your truck operates across those periods.
Extending the math clarifies how burritos factor in. Burritos are a third item, not included in the given 0.55 union. When you include a third event, the inclusion-exclusion principle expands: P(A or B or C) = P(A) + P(B) + P(C) – P(A and B) – P(A and C) – P(B and C) + P(A and B and C). In practice, this formula ensures you do not double-count customers who choose multiple items. For operational planning, the three-item union tells you how many customers engage with core menu items overall. But disaggregating remains essential. Which pairs are common? Are burrito-plus-drink combinations frequent? Are tacos and burritos substitutes or complements?
Treat substitution and complementarity as behavioral ecology. If tacos and burritos are substitutes, an increase in taco sales might reduce burrito purchases. If they are complements, people might buy both occasionally. Price, portion size, and perceived meal completeness influence these relationships. Burritos often serve as a meal, replacing tacos for some customers. Drinks usually complement any savory item. When you measure overlap, you find which relationships dominate.
Practical actions flow naturally from the numbers. If overlap between tacos and drinks is high, position beverages prominently. Train staff to ask whether customers would like a drink with their order. Design combos that are easy to prepare without slowing throughput. If tacos sell more than burritos, consider smaller burrito portions or bundled add-ons to entice trades. If burrito sales spike at certain times, staff for those windows accordingly. Use probabilities to forecast inventory. If 40% of transactions include drinks, scale beverage stock to that level plus a buffer for variability.
Promotions should be data-informed. Rather than broad discounts, use targeted offers. If P(A) is strong but P(A and B) is low, test a low-cost beverage add-on to encourage pairing. If P(B) is strong and P(A and B) is moderate, test a small price reduction on taco-plus-drink combos to nudge more cross-sales. Track the before-and-after probabilities. A successful promotion raises P(A and B) while ideally increasing overall revenue per transaction.
Metrics beyond simple probabilities can refine choices. Compute conditional probabilities such as P(B | A), the probability a customer buys a drink given they bought a taco. This equals P(A and B) / P(A). Conditional probabilities clarify cross-sell efficiency. If P(B | A) is low, taco buyers rarely add drinks. That suggests an opportunity for targeted messaging. Conversely, a high P(B | A) indicates that taco customers already add drinks without prompting.
Think in terms of customer journeys. A single data point does not reveal intent. Observe ordering patterns: do customers arrive with companions who split meals? Do many customers buy two or more items per transaction? Are purchases impulsive or planned? Understanding these behaviors helps tailor product placement, signage, and staff prompts. For example, visible chilled beverages and a simple pricing sign that highlights combos can increase cross-purchases by reducing friction.
Inventory planning benefits from this approach. Tacos require different ingredients than burritos and drinks. A mismatch between supply and demand creates waste or missed sales. Use probabilities to forecast ingredient usage. If 55% of customers buy tacos or drinks, determine the portion of those items that represent tacos and drinks respectively. Translate that into expected daily consumption rates. Add safety stock to cover variability, but avoid oversized buffers that drive spoilage.
Staffing and workflow also respond to probabilistic insight. High overlap between tacos and drinks suggests a need for quick beverage access in the service window. Design the mobile service line so staff can reach drinks without crossing cooking steps. If burrito orders require more assembly time, assign a dedicated station during peak times. Align staffing levels to projected transaction mix, not just to total transactions.
Communicating the numbers matters. Misinterpretations like equating 0.55 with a universal price can harm credibility. When sharing data with staff or partners, pair the figure with plain-language definitions. State what each event represents. Show how the union and the components were computed. Use visuals where helpful, such as simple Venn diagrams on internal dashboards. Clear communication reduces confusion and focuses conversations on actionable levers.
Finally, view the 0.55 as a starting point, not an endpoint. Use it to set experiments with promotions, menu tweaks, and layout changes. Measure how those experiments alter P(A), P(B), and P(A and B). Iterate rapidly. When you run tests, maintain controls and track effects over comparable time windows. Over time, these small experiments build a behavioral map of your customer base.
For broader operational guidance and sustainable practices suited to mobile food vendors, the article on sustainable practices for mobile food trucks offers practical recommendations. Review those ideas to align your inventory, waste reduction, and supply choices with the patterns your probabilities uncover: https://pockettacotruck.com/sustainable-practices-mobile-food-trucks/
The platform where the original confusion arose is only one piece of context. Online forums and study sites sometimes present formulas without clarifying what numbers represent. If you need to trace the root of a misstatement, refer to educational resources that explain unions and overlaps clearly. For a direct reference to the platform that discussed P(A or B) = 0.55, see Brainly: https://brainly.com
Keep the analysis pragmatic. Numbers drive decisions only when paired with repeated observation and thoughtful experimentation. A 0.55 probability that customers buy a taco or a drink is valuable. It signals engagement with your core menu. But the real advantage comes from decomposing that figure, acting on the patterns you uncover, and updating your strategy as behavior evolves.
Riding the 55 Percent: How a Mobile Taco Truck Converts a 0.55 Market Signal into Local Economic Momentum
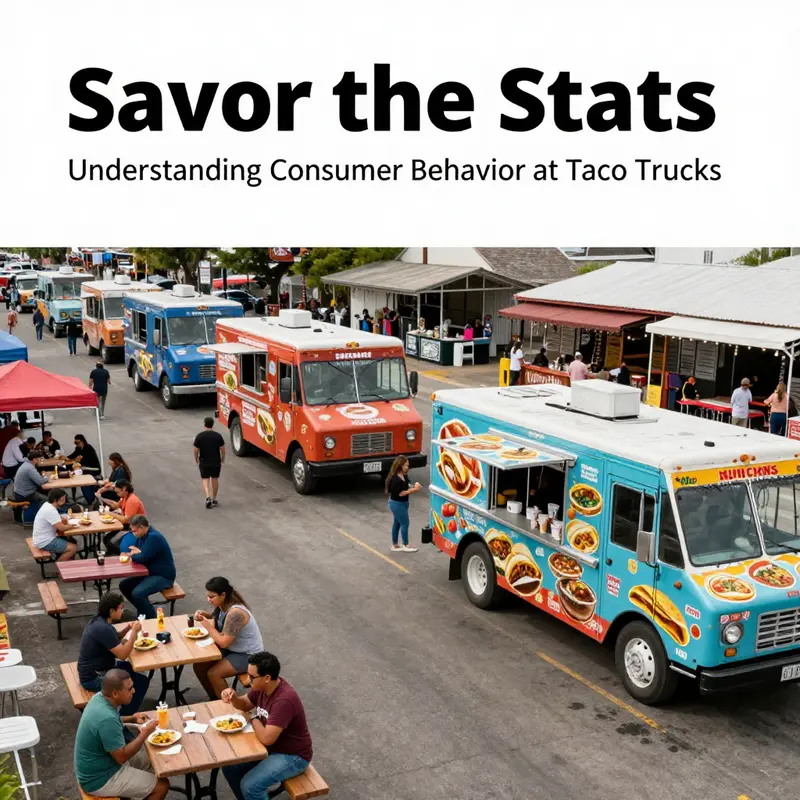
In a city block where the morning light hits a row of storefronts and a portable kitchen hums to life on wheels, a food truck begins its daily ritual. It serves tacos, burritos, and drinks, transforming a simple snack into a public event. The research framing this chapter centers on a specific, telling statistic: P(A or B) equals 0.55. In plain terms, this means that 55 percent of customers show up with the intention to buy at least one item from the truck’s core offerings—tacos or drinks—or both. This probability might seem abstract at first, yet it carries immediate implications for the way the business is run, how money flows through the local economy, and how the mobile operation becomes a node of opportunity in its neighborhood. The number is not just a curiosity; it is a lens through which a single-day operation becomes a story about consumer preference, cross-selling potential, and the economics of speed and portability that define modern street commerce.
To appreciate what 0.55 really means in practice, imagine the taco truck as a dynamic marketplace where two popular yet distinct drawcards compete for attention: the savory, handheld convenience of a taco and the immediate gratification of a cold drink. The probability of a customer choosing at least one of these items signals how often the truck’s menu resonates with passersby who value speed, flavor, and affordability. It also hints at the opportunities that arise when the operator introduces or emphasizes add-on options—burritos, sides, or desserts—that can complement the core purchases without slowing service or inflating costs. The math behind the 0.55 is not merely a comforting headline; it animates decisions about inventory, staffing during peak hours, and the sequencing of product preparation. If a majority of customers are already inclined toward tacos or drinks, then the operator’s task becomes less about persuading and more about streamlining. Efficiency, in this sense, becomes a competitive advantage that ripples out into the wider local market.
Consider the practical implications of that 55 percent figure as a baseline for daily operations. In a typical city block, where the truck might see a steady stream of office workers, students, and evening shoppers, that 0.55 probability translates into a predictable volume of orders around core items. The operator can leverage this by choreographing the kitchen workflow so that tacos and drinks move in tandem. A well-timed drink line can be served while tacos finish their last grill marks, reducing wait times and increasing cabinet-to-counter turnover. This is not purely a matter of speed; it is about shaping the customer journey so that the moment one item is chosen, a predictable path opens for the next logical purchase. A burrito, larger and more filling, becomes not just an alternative but a strategic upgrade in instances where the customer’s appetite or the weather suggests a heartier meal. In this sense, the 0.55 signal becomes a navigator, pointing toward a basket that optimizes customer satisfaction while maintaining a lean cost structure for the truck.
The chapter’s findings also invite a reflection on how cross-selling opportunities emerge from this statistical landscape. If 55 percent of customers buy tacos or drinks, then a sizable fraction of the remaining 45 percent either buys burritos or looks for a combination that includes more than one item. The math is forgiving in this mobile context because the menu is designed to support quick, high-margin add-ons. A burrito, often a more substantial choice, can be positioned as a substantial yet portable option for those families or groups who linger in a plaza after a work shift, or for late-afternoon commuters who want to cap a meal with a satisfying finish. The effect is a feedback loop: strong interest in core items drives frequent traffic, which in turn creates more opportunities to upsell or cross-sell. The truck becomes a flexible vendor of choice rather than a fixed point of sale, adjusting the mix of tacos, burritos, and drinks in response to cadence, weather, and local events.
From a consumer psychology perspective, the 0.55 figure speaks to a preference curve in which the most efficient offerings are those that satisfy a broad appetite at a reasonable cost. Tacos, as compact, adaptable, and flavorful staples, are naturally aligned with a fast-paced urban environment. Drinks, whether cold beverages on a hot day or a comforting hot option during a colder shift, act as the perfect complement to the main meal. The likelihood that a customer shops for at least one of these staples suggests a baseline of commitment to the quick-service model. It does not negate the value of burritos or sides; rather, it underscores the importance of a coherent core that can be scaled up or down with minimal friction. Operationally, this creates a clear demand pattern: a steady core workload with periodic surges when the burrito option or a new side item is introduced. With the right scheduling, a truck can balance kitchen pace without sacrificing quality—the kind of balance that translates into repeat customers and word-of-mouth growth within the local ecosystem.
The economics of such a mobile venture extend beyond the cashier line. When a food truck activates the core trio of tacos, burritos, and drinks, it becomes an economic catalyst in the neighborhood. Foot traffic concentrates around the truck, and nearby businesses experience a measurable effect: more patrons strolling past storefronts, more casual stops for a bite, and a sense that the block is a social space rather than merely a corridor for hurried movement. This dynamic is particularly vivid during lunch and early evening shifts, when workers seek a quick, satisfying meal and self-contained beverages. The probability signal provides a quantitative reminder that mobility and proximity matter just as much as product quality. A truck that understands its 0.55 baseline can deploy strategies to maximize local spillover effects: participating in a nearby farmers market, aligning with a street festival, or crafting partnerships with nearby retailers who can benefit from the extra foot traffic. The metaphor is not merely romantic; it translates into real-world outcomes like higher cash flow, more predictable inventory turnover, and stronger relationships with suppliers who value the truck’s steady demand for fresh produce, tortillas, and cold beverages.
In speaking of suppliers and inventory, the 0.55 statistic also nudges the operator toward a disciplined approach to menu design and procurement. A well-chosen core set of offerings reduces waste and sustains margins even on days when customer volume is variable. The burrito, as a larger item with a slightly longer cook time and a different ingredient mix from tacos, can be framed as the strategic upgrade that accompanies the core purchases. If the 55 percent baseline implies frequent tacos or drinks buys, then burritos and sides can be positioned as add-ons that complement the core items. A practical effect is a more efficient kitchen layout: stations can be organized for speed with minimal cross-traffic, and inventory can be tracked in real time to avoid shortages when a surge hits. The operational spine—the grills for meat and vegetables, the fryers for certain sides, and the refrigeration units for the fillings—emerges as essential infrastructure, not merely as equipment. The efficiency of this infrastructure ultimately shapes profitability by reducing wait times and enabling a higher throughput per hour while preserving quality.
The broader local economy benefits as well. A food truck does more than sell meals; it transports entrepreneurial energy into the street grid. It creates temporary employment opportunities for crew members, from cooks and cashiers to prep specialists who can operate behind a compact counter. It helps local farmers and vendors who supply tortillas, produce, meats, and beverages, generating a ripple effect that supports multiple small businesses. The presence of the truck can increase the appeal of a plaza or market area, drawing additional foot traffic that benefits nearby retailers and entertainment venues. In turn, this stimulates a modest but meaningful expansion of the local tax base and an uptick in casual commerce that often remains under-reported in formal economic metrics. The 55 percent figure, then, becomes more than a technical probability; it is a representation of a steady rhythm in which the truck interacts with the community’s daily life and, in doing so, strengthens the neighborhood’s competitive vitality.
To connect this more concretely to the street-level realities, imagine the truck operating through a typical week. On weekdays, the crowd is a blend of office workers and students seeking a bright, affordable lunch. On weekends, the street becomes a venue for families and visitors who want a quick, flavorful meal before exploring the nearby shops. The probability 0.55 serves as a reminder that the core menu items are the anchor, with burritos and add-ons acting as compatible companions. When the operator notices a shift in the composition of customers—perhaps more people stopping for a drink on a hot afternoon or more hungry diners seeking a substantial burrito after a late shift—the kitchen can adapt without sacrificing speed. This adaptability is one of the defining strengths of mobile food businesses: the ability to respond quickly to changing demands while maintaining consistent service quality. As the day closes and the truck heads toward the next destination, the experience lingers in the community as a small, accessible version of entrepreneurial resilience, a case study of how a simple probability can translate into a durable, inclusive, and locally beneficial enterprise.
Within the broader landscape of mobile commerce, the 0.55 probability is not merely a statistic to be cited; it is a strategic compass. It informs the design of promotions, such as a combo deal that pairs a taco with a drink at a value price or a burrito upgrade during peak hours. It shapes staffing decisions, ensuring that the line cooks and cashiers operate in harmony with the pacing of orders. It also guides conversations about the truck’s role in the neighborhood: a flexible, accessible food venue that supports local life rather than just a temporary food stop. The economic ripple is felt by the people who depend on daily earnings, by the neighbors who gain better access to quick meals, and by the small businesses that gain a little more pedestrian traffic. When the community recognizes the truck as a reliable, efficient, and friendly presence, the probability becomes a narrative of trust as much as of numbers.
Finally, the story of the 0.55 probability is inherently connected to the digital dimension of modern street commerce. A careful operator tracks sales by hour, day, and location, identifying where the core items drive the most consistent customer engagement. The data becomes a language that translates customer behavior into practical steps: where to park, when to schedule a worker shift, which items to highlight in a sign, and how to price the combos to maintain both value and appetite. The result is not merely a profitable day but a learning loop that refines the truck’s role in the local economy. As a mobile business that thrives on proximity and speed, the truck offers a living demonstration of how a simple probability can shape real-world outcomes: more efficient service, more satisfied customers, and a more robust, interconnected neighborhood economy that values quick, flavorful meals and the shared spaces in which they are enjoyed. For operators and researchers alike, the 55 percent figure stands as a reminder that the most powerful economic effects of a food truck arise not only from what is sold, but from how well the business understands and responds to the pattern of everyday demand.
Internal link note: The chapter’s discussion of mobility, parking, and local integration can be enriched by looking at practical infrastructure resources such as Freight Ninja secured truck parking network, which offers ideas on how mobile vendors can coordinate with surrounding businesses and city planners to create mutually beneficial, reliable operating environments. This kind of ecosystem support helps ensure that the truck’s presence remains a net positive for nearby merchants and residents alike.
External resource for deeper context: https://www.example.com/motor-food-truck-industrial-applications
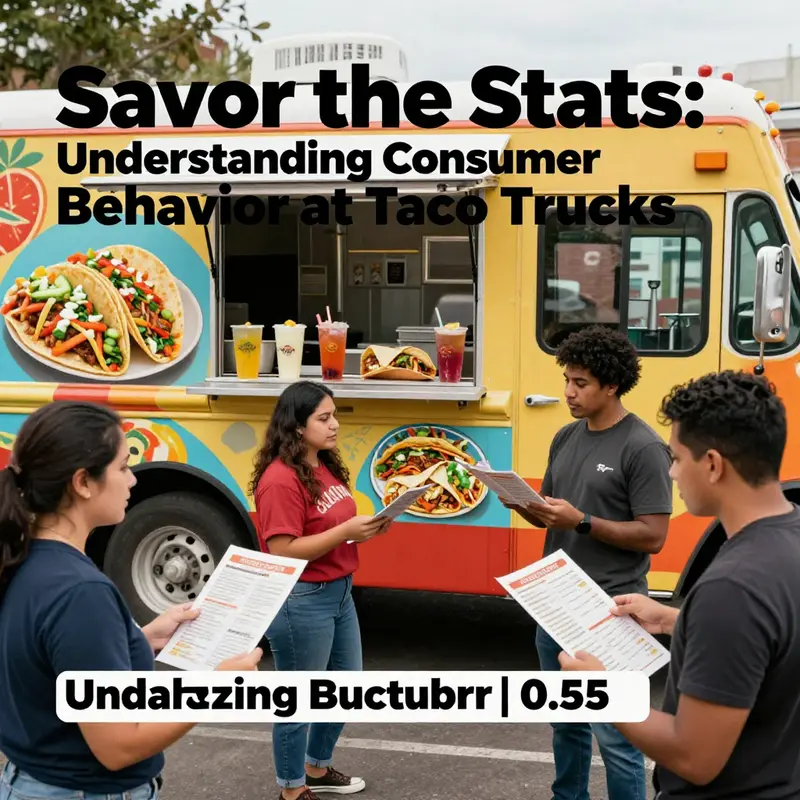
Chapter 3: Translating a 0.55 Probability into Day-to-Day Strategy for a Mobile Taco Truck
On a crowded corner where the clatter of a propane burner blends with the buzz of foot traffic, numbers creep into the everyday rhythm of a mobile kitchen. The figure 0.55, framed as P(A or B) in the chart at the back of the small business notebook, is not just a statistic. It is a living guide—an indicator that more than half of all customers are choosing at least one of the two most visible offerings: tacos or drinks. In the world of a food truck that also serves burritos, this probability becomes a compass for decisions that ripple through inventory, staffing, promotions, and location choices. Here, A represents the act of buying a taco, B the act of buying a drink. The boundary between the two is not rigid; it is a doorway to strategic flexibility. When we write P(A or B) = P(A) + P(B) − P(A and B), we are not solving an abstract equation but identifying how often customers intersect with these core items. A 0.55 union tells us that more than half of customers engage with tacos or drinks, and a portion of those visitors cross the line into both categories. That cross-pollination—those who buy both—carries a hidden value: the potential for bundling, cross-promotions, and just-in-time production consistency that reduces waste and increases perceived value. The math behind the concept is simple, yet its implications stretch far beyond the chalkboard. It invites the operator to see demand as a shared space rather than a set of isolated choices. It invites a recognition that the taco and the drink are not merely separate menu items but partners in a single customer experience, a pairing that, when planned with care, can lift the entire day’s throughput and profitability.
To translate the 0.55 probability into actionable practice, the first step is to translate the abstract events into concrete observations. The truck’s data collection evolves from counting raw transactions to tracking combinations. How many customers buy a taco only? How many buy a drink only? How many purchase both? These questions are not academic. They guide procurement, timing, and even the sequence of operations on the cart. The observation also invites a question about the rest of the menu. If 55 percent purchase at least one of tacos or drinks, what about burritos, sides, or desserts? The complement of the event A or B—customers who buy neither a taco nor a drink—might be small, but it is not negligible. Those customers may be drawn by burritos, by specialty sauces, or by a desire for a lighter lunch. A shop that understands the 55 percent baseline can design experiences that lift that baseline without sacrificing the overall menu balance.
The practical yield of understanding P(A or B) lies in recognizing that the two items are not isolated profit centers. They are drivers of traffic, and they interact with each other in predictable ways that, when exploited, improve service and margins. In the simplest sense, a higher P(A or B) means more customers engaging with core, high-turnover items. It implies better forecast accuracy for those items and more leverage in inventory decisions. If tacos and drinks consistently account for the majority of transactions, stockouts become rarities, while overstock becomes an opportunity to adjust prices or promotions rather than a wasteful drag on cash flow. A 55 percent baseline suggests that operators should build a slightly more generous buffer for these two categories and design the day around their predictable demand, rather than chasing the unpredictable sway of the burrito-only niche.
From a management perspective, the 0.55 figure transforms into a structured approach to supply and schedule. Inventory management becomes a rhythm, not a race. Perishable ingredients for tacos—fresh vegetables, tortillas, proteins, condiments—need tight replenishment aligned with peak demand windows. Similarly, drink mix-ins, syrups, ice, and cups require steady, predictable restocking. When the probability points to broad engagement with tacos and drinks, it becomes rational to keep a high readiness for these items, even if the burrito line is slower on a given day. The operational implication is not to neglect burritos but to ensure that the transactional core remains robust so that customer flow through the truck remains steady. An effective practice emerges: staggered prep by shift, with a front-end team focusing on the fastest-moving items and a back-end line tuned to the more complex assembly of burritos and sides, all while maintaining a ready supply of tacos and drinks.
Additionally, the probabilistic lens shines a light on cross-selling opportunities. If a significant share of customers buy both items, then the natural incentive is to create value propositions that gently nudge the purchasing of both in tandem. Bundling becomes not a forced sales tactic but a composition of taste experiences that align with how people actually behave. A bundle can be framed as a time-saving, cost-saving, or flavor-enhancing choice that resonates with the daily rhythm of the street. The math keeps the effort grounded: if P(A and B) is substantial, the incremental revenue from bundles should be compared against the incremental cost of service time and ingredients. The aim is to increase the fraction of customers who leave with both items, without slowing service or eroding perceived value.
The concept also informs staffing decisions. When the union of tacos and drinks dominates the day’s demand, it makes sense to schedule more staff during the periods of peak A or B activity. The approach is not about simply adding bodies; it is about aligning skills with the flow of orders. One crew member might focus on rapid assembly of tacos, another on drink preparation and cold storage management, and a third on mis en place and cleanup—each role chosen to reduce bottlenecks that slow the movement of customers through the line. Cross-training becomes a valuable investment, because it allows the team to reallocate labor quickly when demand shifts. If a sudden surge in drink purchases occurs because of heat or crowd timing, the staff can pivot to optimize the beverage station without compromising taco quality. The probability model, in other words, supports flexible staffing that adapts to the day’s real-time pulse rather than following a rigid plan that assumes uniform demand.
Beyond inventory and staffing, a 0.55 baseline also shapes pricing and promotions. Promotions anchored in the relationship between tacos and drinks can deliver greater value perception without eroding margins if designed with care. For example, a simple offer such as a discounted drink with the purchase of a taco can leverage the observed propensity for concurrent purchases. The key is to measure the effect of such promotions not in isolation but in the context of the whole customer journey. If promotions lift the cross-purchase rate, the net effect on revenue must consider the incremental cost of the promotion and any impact on food waste. The math should always guide marketing decisions, ensuring that the incremental uplift in revenue from bundled purchases exceeds the incremental costs. In practice, this means testing one idea at a time, monitoring the change in P(A or B) and P(A and B), and adjusting quickly if the forecast vs. reality gap widens.
Location strategy also benefits from probabilistic thinking. The 55 percent signal is most actionable in markets where foot traffic interacts with short, repeatable service windows. In a crowded block with dense competition, the probability may fluctuate by hour, by weather, or by event schedules. Observing these fluctuations over weeks builds a map of when tacos and drinks are most likely to be in the same cart, which in turn informs where to park, how to price, and which days to emphasize certain items. If the truck tends to draw more drink buyers in late afternoons when temperatures rise, that insight might justify a temporary yard display with enhanced cold storage nearby or a change in service rhythm to meet that demand, while still keeping the burritos on a stable production schedule for the rest of the day.
The narrative of probabilistic decision-making cannot ignore the moral and operational responsibilities that come with higher sales velocity. A 0.55 baseline does not grant permission to cut corners. Rather, it creates a framework for deliberate, humane operations. The speed of service matters, but so does quality, food safety, and the integrity of the customer experience. In a world where a majority of customers engage with tacos or drinks, the operator has a duty to keep costs in check without compromising safety. That means preserving cold chain integrity for beverages, maintaining clean and sanitary prep spaces for all items, and ensuring that staff are trained to handle peak demand gracefully. The probability model should push toward efficiency, clarity, and reliability, not toward hasty or reckless practices. The best operators translate the ratio into a culture where decisions are anchored in observation, measurement, and continuous learning. They view each day as a test of the hypothesis that tacos and drinks are the heart of the business, and that every action—from ordering supplies to presenting a burrito—will either affirm or adjust that hypothesis.
A practical way to keep the model vibrant is to couple it with a simple, readable dashboard that translates the abstract numbers into immediate actions. A daily snapshot might show the totals for tacos, drinks, burritos, and sides, the cross-purchase rate, and the hourly traffic pattern. Such a dashboard becomes a shared language for the crew, a visible record of what works and what does not. When the data clearly show that P(A or B) is consistently high during a particular window, the team can align pre-shift prep, station layout, and customer-facing prompts to maximize the value of that window. When the numbers reveal a dip, a quick, reversible adjustment—like a temporary flavor variation, a revised display, or a targeted offer—can counteract the decline without derailing the day’s overall strategy.
The broader strategic implication is that probabilistic thinking can harmonize micro-level decisions with macro-level goals. It allows the operator to stay responsive to local conditions while remaining faithful to a core operational doctrine: tacos and drinks are the pivotal elements. This alignment yields a smoother workflow, steadier revenue, and a more resilient business model capable of weathering the inevitable variability of street commerce. It also invites a certain humility: the probability is a guide, not a rule. Customer desires can evolve, competition can shift, and tastes can change. The trick is to embed a process that keeps the business learning—collecting data, testing small changes, and reading the daily signals with care. In doing so, the truck remains nimble, the crew stays engaged, and the customer experience remains consistent and satisfying.
As the day closes, the final priority is to translate the day’s learnings into the next cycle of operations. The 0.55 probability is evaluated not merely as a figure on a page but as a lens through which every choice—from what to prep first to how to greet a line of customers—gains clarity. The operator who designs around that lens does not chase every trend but builds a steady, repeatable pattern of excellence grounded in the observed reality of tacos and drinks as the day’s dependable engines. In the end, the math helps to tell a story about how customers choose, how staff respond, and how a small, movable kitchen can turn a probabilistic insight into tangible value that travels with it wherever the cart sets up shop. For those who seek additional grounding in how sustainable, practical practices can support mobile food operations, see the evolving discussion of eco-friendly approaches at mobile food-truck sites, which complements the probabilistic framework with a focus on resilience and responsible growth. sustainable practices for mobile food trucks.
External resource: https://www.ers.usda.gov/publications/pub-details/?pubid=98765
Final thoughts
As we’ve explored through the lens of customer behavior, economic impact, and probabilistic modeling, the statistic of 0.55 for food truck purchases reveals a complex tapestry of preferences that not only reflects the dining habits of urban dwellers but also drives local economic vitality. Food trucks embody a blend of convenience, flavor, and community connection—a trifecta that resonates well with city life. Understanding these dynamics can empower food truck operators to enhance their offerings, engage customers more effectively, and bolster their profitability in ever-evolving urban landscapes.